What is the Cost of Goods Sold (COGS):
The QuickBooks creates two accounts whenever an inventory item is set up.
These accounts are:
- 12100 – Inventory Asset – Other Current Asset
- 50100 – Cost of Goods Sold (COGS) – Cost of Goods Sold
A purchase of an inventory item debits (+) the Inventory Asset account, and the sale of an inventory item credits (-) this account.
COGS, on the other hand, is generally debited (+) when an inventory item is sold.
A sales of an inventory item affects four accounts.
- Inventory Asset
- COGS
- AR
- Income
The amount on AR and Income account is Number of Items Sold x Average Cost of Item.
The amount on Inventory Asset and COGS is Number of Items Sold x Average Cost of Item.
Number of Items Sold is the quantity on the transactions.
Let’s talk about Average Cost of Item.
Let’s understand it with an example:
- If you purchase the 2 items for $5.00, then the current average cost is (5 + 5) / 2 = $5.00. Right now the Total asset value is $10.
- When you again purchase the same item for $3.00, then the current average cost will be (Total Asset Value + New purchase cost) / Total quantity. So it is ($10 + $3) / 3 = $4.33
- Now suppose you sell one of the items then the average cost remains $4.33, but the Total Asset values is $4.33 * 2 = $8.67.
- You repurchase the same item for $5.50 then the current average cost will be(Total Asset Value + New purchase cost) / Total quantity. So it is ($8.67 + $5.50) / 3 = $4.72
So, as explained in this example, it is quite evident that the average cost of an item keeps changing.
It is also apparent that an inventory item has two types of average costs.
- Current average cost
- Historical average cost
The current average cost is good enough to use if the report is showing the COGS amount for the current date.
The historical average cost is required to show the past values of COGS amount.
The QuickBooks standard reports use current or historical average cost automatically depending on the dates of the report.
The QuickBooks Advanced Reporting also have these average costs.
Let’s see the place to find them and how to use them.
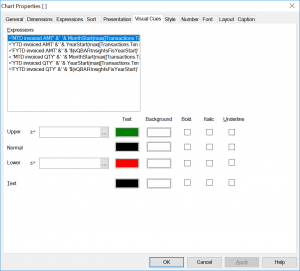
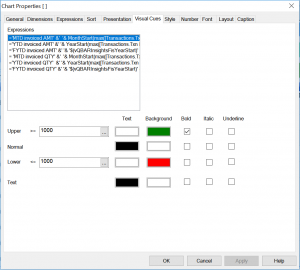
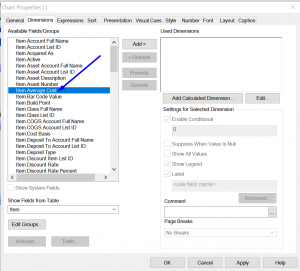
Current Average Cost of Item in QuickBooks Advanced Reporting (QBAR):
Historical Average Cost of Item in QuickBooks Advanced Reporting (QBAR):
The ItemHistory table stores the historical average cost of all inventory items.
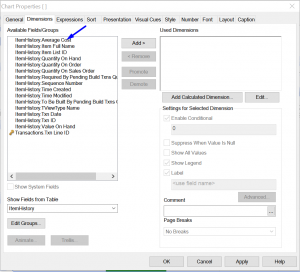
You may use these expressions to find the latest or the oldest average cost of an item:
Latest Average Cost : =FirstSortedValue([ItemHistory.Average Cost], -[ItemHistory.Sequence Number])
Oldest Average Cost: =FirstSortedValue([ItemHistory.Average Cost], [ItemHistory.Sequence Number])
Here is a challenge for you:
Write an expression to find the COGS amount using the historical average cost.