Streamlining Inventory Management for Manufacturing: Introducing the Accurate Inventory Report.

I have been building reports for QuickBooks Enterprise Businesses for quite some time. Almost 99.99 % of reports have been unique for each business. But there are very few reports that have helped more than one business. These reports are related to assembly and inventory management.

Effective inventory management is the lifeblood of any manufacturing business. It ensures smooth operations, timely order fulfillment, and customer satisfaction. However, determining accurate inventory quantities for assembly items on open sales orders can take time and effort. As a seasoned professional in building reports for QuickBooks Enterprise Businesses, I have witnessed firsthand the struggles faced by manufacturers in this aspect.

  • Unique Challenges: Each business is unique, with its own set of assembly items, sales volume, and levels of subassemblies and inventories.
  • Manual Effort and Errors: Business owners often hire employees and utilize tools like Excel to perform inventory calculations, but these processes are prone to errors and consume valuable resources.
  • Expensive Third-Party Solutions: Some manufacturers turn to expensive third-party solutions that fail to provide the specific information they seek: the precise number of inventory items required to fulfill sales orders.

Manufacturing industries face challenges determining the inventory requirements for assembly items on open sales orders.

There could be many reasons for that. The most common ones are as follows:

  1. The staggering number of assembly items one company has.  
  2. The sales volume.
  3. The levels of subassemblies and inventories have gone into assemblies.

All these factors make it a daunting and tedious task to determine the exact inventory quantities needed to build the assemblies to fulfill the order.

So, what happens when a manufacturing company cannot have this information at its fingertips? 

Manufacturers need more accurate quantities of inventory required to fulfill assemblies on sales orders. These issues can have significant consequences for their operations and customer satisfaction:

  • Overbuilding: Without precise inventory information, manufacturers may overbuild assemblies, resulting in wasted resources, labor, and increased costs. Excess inventory can tie up capital and lead to obsolescence.
  • Underbuilding: Insufficient inventory quantities can delay order fulfillment, causing customer dissatisfaction, missed deadlines, and potentially lost sales opportunities. Manufacturers risk damaging their reputation and customer relationships.
  • Inefficient Resource Allocation: Without accurate inventory data, manufacturers struggle to allocate resources effectively. They may allocate excess labor, machinery, or materials to compensate for uncertainties, leading to inefficiencies and unnecessary costs.
  • Manual and Error-Prone Processes: Some manufacturers estimate inventory needs using manual calculations, spreadsheets, or outdated systems. These manual processes are time-consuming, prone to errors, and can hinder productivity.
  • Limited Visibility and Decision-Making: Inaccurate inventory information limits manufacturers’ visibility into their supply chain and production processes. It hampers their ability to make data-driven decisions, plan effectively, and optimize operations.
  • Lost Business Opportunities: Inaccurate inventory quantities can lead to missed sales opportunities and lost revenue. Manufacturers may need help to fulfill orders on time, resulting in canceled orders and dissatisfied customers who may seek alternative suppliers.

These challenges emphasize the critical need for accurate, real-time inventory information to support efficient assembly fulfillment. By addressing these issues, manufacturers can streamline their operations, reduce costs, enhance customer satisfaction, and gain a competitive edge in the market.

Any business may make such mistakes once or twice, but your business needs fixing if it starts happening now and then. I know one company that lost millions of dollars of candy orders from Walmart because they could not accurately determine the amount of sugar needed to fulfill the order on time.

This is where I come in. Having encountered numerous manufacturing businesses needing assistance, I have developed two reports addressing this critical inventory management challenge.

  • Tailored Solution: My reports offer a tailored solution to the unique requirements of manufacturers, providing them with accurate information to streamline their assembly processes.
  • Leveraging QuickBooks Advanced Reporting: I have harnessed the capabilities of this robust tool to generate reports that empower manufacturers to make informed decisions and optimize their inventory management.

Imagine the benefits of having the exact number of inventory items needed to build assemblies readily available at your fingertips.

  • Increased Efficiency: No more overbuilding or underbuilding results in wasted resources or jeopardizes customer relationships and revenue.
  • Cost Reduction: Optimize your resources by eliminating unnecessary inventory build-up or shortages.
  • Improved Customer Satisfaction: Ensure timely order fulfillment and meet customer expectations consistently.

With these reports, you can unlock the potential for increased operational efficiency, reduced costs, and improved customer satisfaction. Say goodbye to the complexities of manual calculations and costly software investments that fail to deliver.

  • Focus on Growth: My goal is to help manufacturers like you achieve seamless inventory management, enabling you to focus on growing your business.
  • Power of QuickBooks Advanced Reporting: Join me on this transformative journey as we explore the capabilities of QuickBooks Advanced Reporting and its impact on your manufacturing operations.

To show the workings of these reports, let’s assume that the company file has the following status of items.

AssemblySub AssemblyRequired Qty of sub-assemblies to build assembly itemInventory component of sub-assembliesRequired Qty of inventory to build sub-assembliesQty on hand of Inventory Items
2nd _lev_assm-1     
 Sub-Assm-12   
   Inv-1210
   Inv-2310
 Sub-Assm-23   
   Inv-3310
   Inv-4210

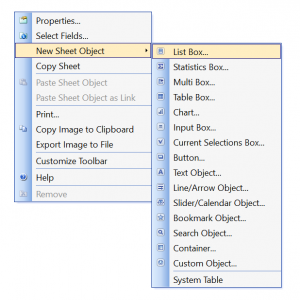
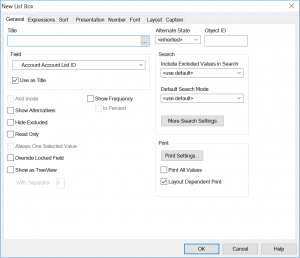
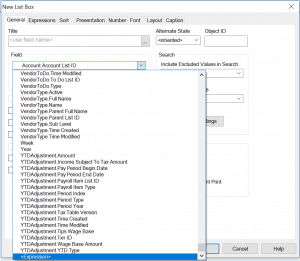
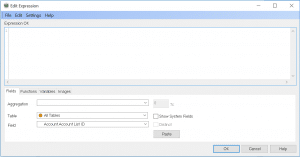
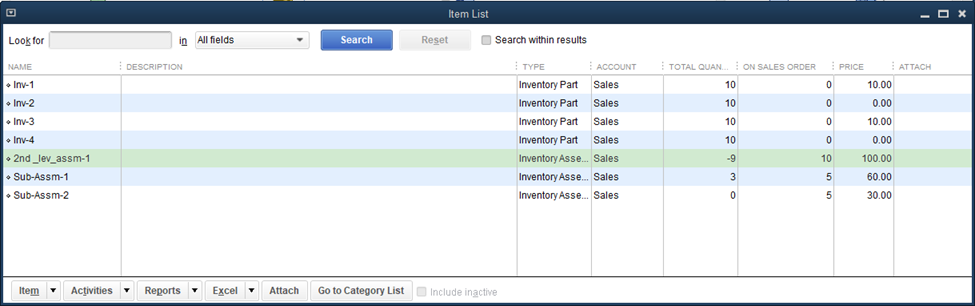
And here is the screenshot from QuickBooks Enterprise showing the Quantity on hand and Quantity on the sales order for each item.

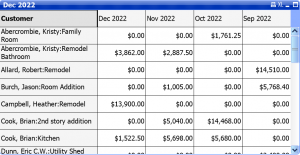
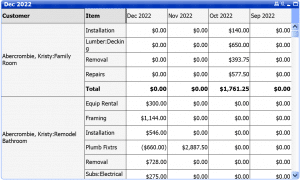
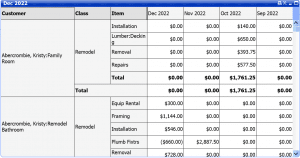
I refer to the first report as the Projected Inventory report, which shows the date below.

Projected Inventory Report:

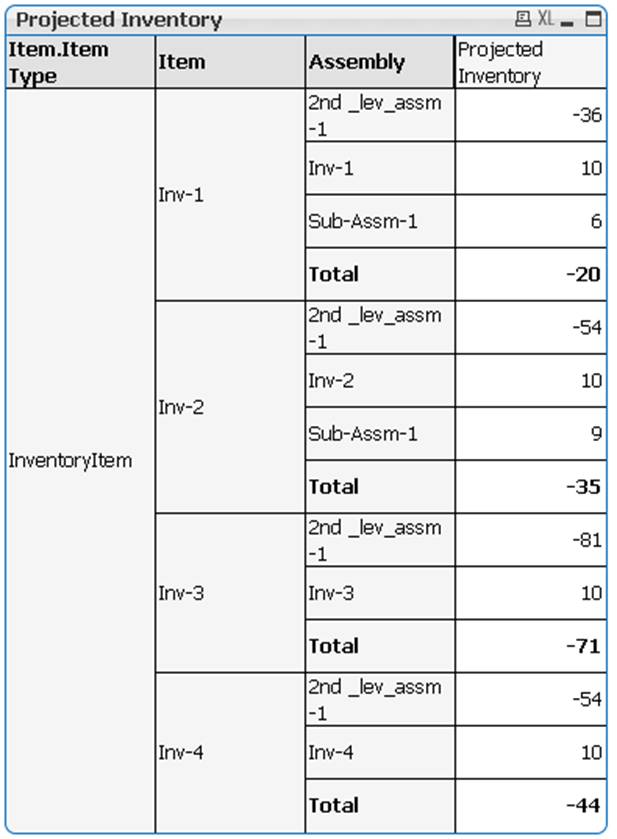
Let’s pick one inventory item, Inv-1, to understand its logic.

Total Quantity of Inv-1 required to build:

  1. 1 unit of Sub-Assm-1= 2
  2. 1 unit of 2nd_lev_assm-1 = 4
  3. 1 unit of Inv-1 = 1

Quantity on hand of:

  1. 2nd_lev_assm-1 = -9
  2. Inv-1= 10
  3. Sub-Assm-1 = 3

The report output for Inv-1 is as follows according to this formula:

Quantity on hand X Total Quantity of Inv-1 required to build.

  1. 2nd _lev_assm-1 = -9 X 4 = -36
  2. Inv-1 = 10 X 1 = 10
  3. Sub-Assm-1 = 3 X 2 = 6
  4. Total = -36 + 10 + 6 = -20

The projected inventory for the inventory item Inv-1 is -20.

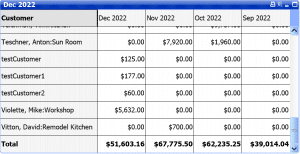
Quantity To Order Report:

The second report shows the data as follows.

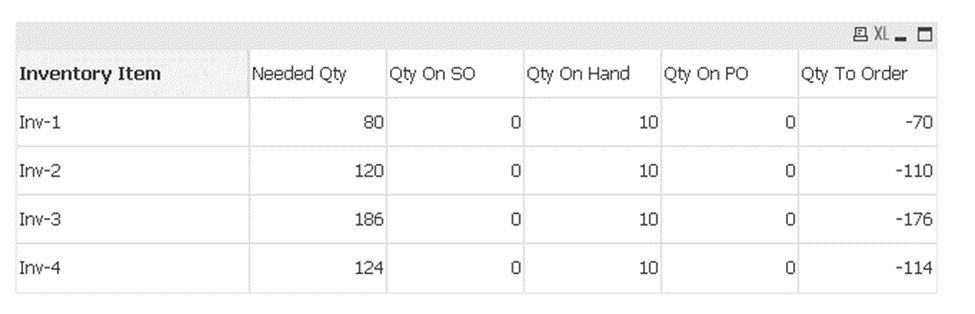
Let’s again pick one inventory item, Inv-1, to understand its logic.

The Needed Qty of Inv-1 for

  1. 2nd _lev_assm-1 = 10 [Quantity on sales order] – (-9) [Quantity on hand] = 19 X 4 = 76
  2. Sub-Assm-1 = 5 [Quantity on sales order] – 3[Quantity on hand] = 2 X 2 = 4

76 + 4 = 80.

Now, the company already has 10 Quantity on Hand for Inv-1. So, the Qty To Order is

[Qty on SO] + [Qty on Hand] + [Qty On PO] – [Need Qty] = -70

Now you know the exact Quantity to order for the Inventory item.

In conclusion, accurate inventory management is more than a goal; manufacturing businesses must thrive in today’s competitive landscape. The challenges of overbuilding, underbuilding, inefficient resource allocation, manual processes, limited visibility, and lost business opportunities highlight the urgent need for a solution that provides accurate inventory information.

By investing in the tailored reports I have developed, manufacturers can overcome these challenges and unlock the potential for streamlined operations, reduced costs, improved customer satisfaction, and increased profitability. Imagine having the power to make data-driven decisions, fulfill orders on time, and optimize your resources effectively. These reports offer a game-changing opportunity to take control of your inventory management and drive success in your manufacturing business. Make sure to keep accurate inventory quantities from hindering your growth and profitability.

Take the first step today and contact me to explore how these reports can transform your operations and position your business for sustainable success in the dynamic manufacturing industry.

How to customize a list box in QuickBooks Enterprise Advanced Reporting

customized list box in QuickBooks Advanced Reporting

This month’s blog is about creating a customized list box in QuickBooks Advanced Reporting. Many times, we develop the report for a specific type of entity like inventory item or customer who has an outstanding balance or just income accounts.

In such cases, we need complementary filters to go along with the reports. It does not make sense to have an item filter with all types of items when the report is only for inventory items.

I am sure you would agree.

So, let’s learn about building a customized list box.

We will show you a few examples, and it can be extended to any extent. It all depends on your needs or your imagination.

Let’s start:

Click anywhere but on an object to open the right-click menu and select “List Box.”

List Box Menu in QuickBooks Advanced Reporting

This window shows up.

New ListBox Dialog in QuickBooks Advanced Reporting

Drop the Field dropdown and scroll till the end.

Choose <Expression>

The expression window will show up.

Here we can type the expression to customize the list box.

To show only the inventory items:

if([Item.Item Type]=’InventoryItem’, [Item.Full Name])

To show inventory and assembly items:

=if(match([Item.Item Type],’InventoryItem’, ‘InventoryAssemblyItem’), [Item.Full Name])

These are simple ones and you can even find them in the library section of QuickBooks Advanced Reporting.

Let’s try little more interesting ones.

Suppose you want to show Items of one type in a comma separated string when a particular item type is selected in another list box.


To do this, first, create a simple list box for “[Item.Item Type].

Now let’s build the more exciting item list box.

Go to the “List Box” menu and choose the expression from the drop-down menu.

Type this expression:

=if (GetSelectedCount([Item.Item Type]) = 1,
 aggr(concat(DISTINCT [Item.Full Name], ‘,’), [Item.Item Type]), [Item.Full Name])

 And voila, you have your nice list box ready.

This trick can be used in many scenarios.

Let’s see one more.

Suppose we want to show only those items for a customer which has been sold over a certain amount to that customer.

Create a List box for [Transactions.Customer Full Name]

And now create the interesting list box.

Go to the “List Box” menu and choose the expression from the drop-down menu.

And Type the following in the expression.

=if(GetSelectedCount([Transactions.Customer Full Name]) = 1,
if(aggr(sum({<[Transactions.Account Type]={‘Income’}>}
[Transactions.Amount With Sign]), [Transactions.Customer Full Name],
[Transactions.Item Full Name]) > 600,[Transactions.Item Full Name] ), [Transactions.Item Full Name])

 This expression shows all items if there is no selection or more than one selection in the Customer list box. Otherwise, it will display only those items which have been bought by this customer for more than $600.

 Watch the video to see it in action.


Monthly Sales Report by Customer, Class & Item in QuickBooks Advanced Reporting

The monthly sales report is probably the most common and vital sales report for any business. It gives an opportunity to monitor the progress of sales goals on a consistent basis.

There are numerous templates for the monthly sales report. Each model serves a different purpose. The QuickBooks, regular sales report, provides a certain kind of template which allows to group the sales across 2 entities (One on the row and other on the column) and time periods as sub-columns.

There are indeed limitations to the customizations for the standard reports. One weakness is not to allow to add more than two entities to group the sales.

This article shows the step-by-step process to build a monthly sales report with the flexibility of adding more than 2 entities to group the sales.

So, let’s begin:

Follow these first few steps as stated here.

Select the pivot table after choosing the “Chart” from the right-click menu.


Choose Pivot Table
Choose Pivot Table

Click “Next>.”

On the dimension tab:

  1. Choose “[Transactions.Customer Full Name]” from the “Available Fields/Groups” list (indicated by blue arrow). Once you select it, then it shows up in the “Used Dimensions” (indicated by red arrow).
  2. Check the “Suppress When Value IS Null” (indicated by green arrow).
  3. Give a label to the dimension (indicated by orange arrow).


Dimension tab in QuickBooks Advanced Reporting
Dimension tab

Click “Next>.”

On the Expression tab:

  1. Type the expression as shown in the image or copy it from here:
    sum({<$(vExprSales), $(vExprPreviousNMonths(0))>} [Transactions.Amount With Sign])
    First Expression in QuickBooks Advanced Reporting
  2. The expression tab looks like this.

    Expression Tab in QuickBooks Advanced Reporting
  3. Type the below statement in the Label.
    =$(vTxtMonthYear(0))

    Expression Tab WIth Label in QuickBooks Advanced Reporting
  4. Copy and paste the same expressions as many as a number of months needed on the report.

    1. To copy; right-click on the expressions and click “Copy.”Copy Expression in QuickBooks Advanced Reporting
    2. To paste; right click on the white area and click “Paste.”Paste Expression in QuickBooks Advanced Reporting
  5. Here is the expression tab with four same expressions and their labels.Four Expressions in QuickBooks Advanced Reporting
  6.       Let’s change these expressions to represent different months.
    1. The month of the  max transaction date of the company file:
      1. Expression:
        sum({<$(vExprSales),$(vExprPreviousNMonths(0))>}[Transactions.Amount With Sign])
      2. Label:
        =$(vTxtMonthYear(0)
    2. Last month:
      1. Expression:
        sum({<$(vExprSales), $(vExprPreviousNMonths(1))>} [Transactions.Amount With Sign])
      2. Label:
        =$(vTxtMonthYear(1))
    3. Second last  month:
      1. Expression:
        sum({<$(vExprSales), $(vExprPreviousNMonths(2))>} [Transactions.Amount With Sign])
      2. Label: =$(vTxtMonthYear(2))
    4. Third last month:
      1. Expression:
        sum({<$(vExprSales), $(vExprPreviousNMonths(3))>} [Transactions.Amount With Sign])
      2. Label:
        =$(vTxtMonthYear(3))
  7. This is how the expression tab looks like:
    All Expressions in QuickBooks Adavnced Reporting

Click “Next>” two times.

On the Presentation tab:

  1. Select the Customer in the “Dimensions and Expressions” list.
  2. Check “Show Partial Sums.” This will show the subtotals.
    Presentation Tab in QuickBooks Advanced Reporting

Click “Next>” three times.

On the Numbers tab:

Select “Money” for all four expressions.

Numbers Tab in QuickBooks Advanced Reporting

Now click on “Finish.”

 The first cut of the report is ready. It shows the data for the last 4 months from the max transactions date of the company file. Since it is a sample file, so the max transactions date is Dec 2022.

First Cut of Monthly sales report in QuickBooks Advanced Reporting

This report is built on the sample file, so the months will differ than your report.

Some color settings will also differ depending on your settings.

On scrolling to the end, there should be subtotals.

Show Subtotals in QuickBooks Advanced Reporting

Now when the first cut is ready, let’s add Item as one more dimension to this report.

Add Item as a dimension:

  1. Right click on the chart and choose properties.
  2. Go to the Dimensions tab.
  3. Choose [Transactions.Item Full Name] from the right-hand lists and click on the “Add” button to add to the “Used Dimensions” list.
  4. Make other settings look like same as shown in the image below.
    Add Item dimension in QuickBooks Advanced Reporting
  5. Go to the Presentation tab and make all settings look like as shown in the image below.
    Presentation Tab in QuickBooks Advanced Reporting
  6. Click Ok.

Now the report is grouping the sales amount by customer and item both.

Second Cut on Monthly Sales Report in QuickBooks Advanced Reporting

Let’s add one more dimension [Transactions.Class Name] to the report.

Just follow the previous steps:

  1. Right click on the chart and click properties and go to the Dimensions tab to choose [Transactions.Class Name].
    Add Class Dimension in Monthly sales Report in QuickBooks Advanced Reporting
  2. This dimension is moved to the second place by clicking on the “Promote” button.
    The “Suppress When Value is Null” is not checked because a class can be null in the sample report on some transaction line items.
  3. Go to the Presentation tab and check the “Show Partial Sum” For this new dimension too.
    Class Presentation tab in QuickBooks Advanced Reporting
  4. Click Ok.

Now the report is grouped into three dimensions.

Third Cut with Class Dimension Monthly sales Report in QuickBooks Advanced Reporting

The same process can be followed to add as many dimensions as needed by your business.

You can even watch the video to learn these steps.


Let us know if you got any questions and comments.